We use cookies, including analytics, to improve Tradeways. · Privacy
Your historical equity curve shows one sequence of results: the sequence that happened. A Monte Carlo simulation asks what the same evidence could look like across many alternative paths. It does not improve the trades or predict the market. It exposes how much the order and recurrence of past outcomes can change the path you would have to trade through.
That distinction makes the simulation useful for a concrete task: testing whether a strategy's apparent stability depends on one favorable sequence. The result is a range of conditional outcomes, not a forecast.
There are two different questions a trader can ask of a trade history:
Projection: What range of outcomes could follow if results resembling this filtered sample recur over the next set of trades?
Reshuffle: How different could the path have been if these exact trades arrived in another order?
The modes use the same source data but answer different questions. Treating them as interchangeable is the fastest way to misread the output.
Tradeways runs both modes in the browser from your actual imported trades. The active account scope and live trade filters define the input, so you can isolate a strategy, symbol, direction, time window, or another supported filter without retyping win-rate and payoff estimates. The Monte Carlo analysis updates when that scope changes and labels the result as a simulation from past trades, not a forecast.
Projection mode builds each path one trade at a time by drawing from the filtered historical outcomes. A result can be drawn more than once or not at all in a given run. That is sampling with replacement.
You choose a horizon, such as the next 100 trades, and the simulation repeats the process many times. The output shows how wide the resulting paths and final outcomes are under one explicit assumption: the selected history is a useful model for the outcomes that may recur.
Projection is appropriate when your question is forward-looking but conditional. It can show that a positive historical average still permits losing paths, deep drawdowns, or long recovery periods. It cannot show whether the strategy's edge will persist, whether market conditions will change, or whether future trades will follow the same distribution.
Reshuffle mode uses every trade in the filtered sample exactly once per path and changes only their order. In an additive P&L view, every path therefore finishes at the same total. What changes is the route to that total: the losing streaks, equity peaks, recovery timing, and maximum drawdown.
This mode answers an attribution question. If the historical curve looks smooth but many alternative orderings contain materially deeper drawdowns, part of that smoothness came from sequence luck. If the drawdown distribution stays tight across orderings, the observed path was less dependent on when wins and losses arrived.
Reshuffling does not create new trade outcomes, and it does not estimate the next set of trades. It also breaks any serial structure in the original sequence. If outcomes depend on regimes, position overlap, or deliberate changes in sizing, interpret the result as an ordering test, not a model of those dependencies.
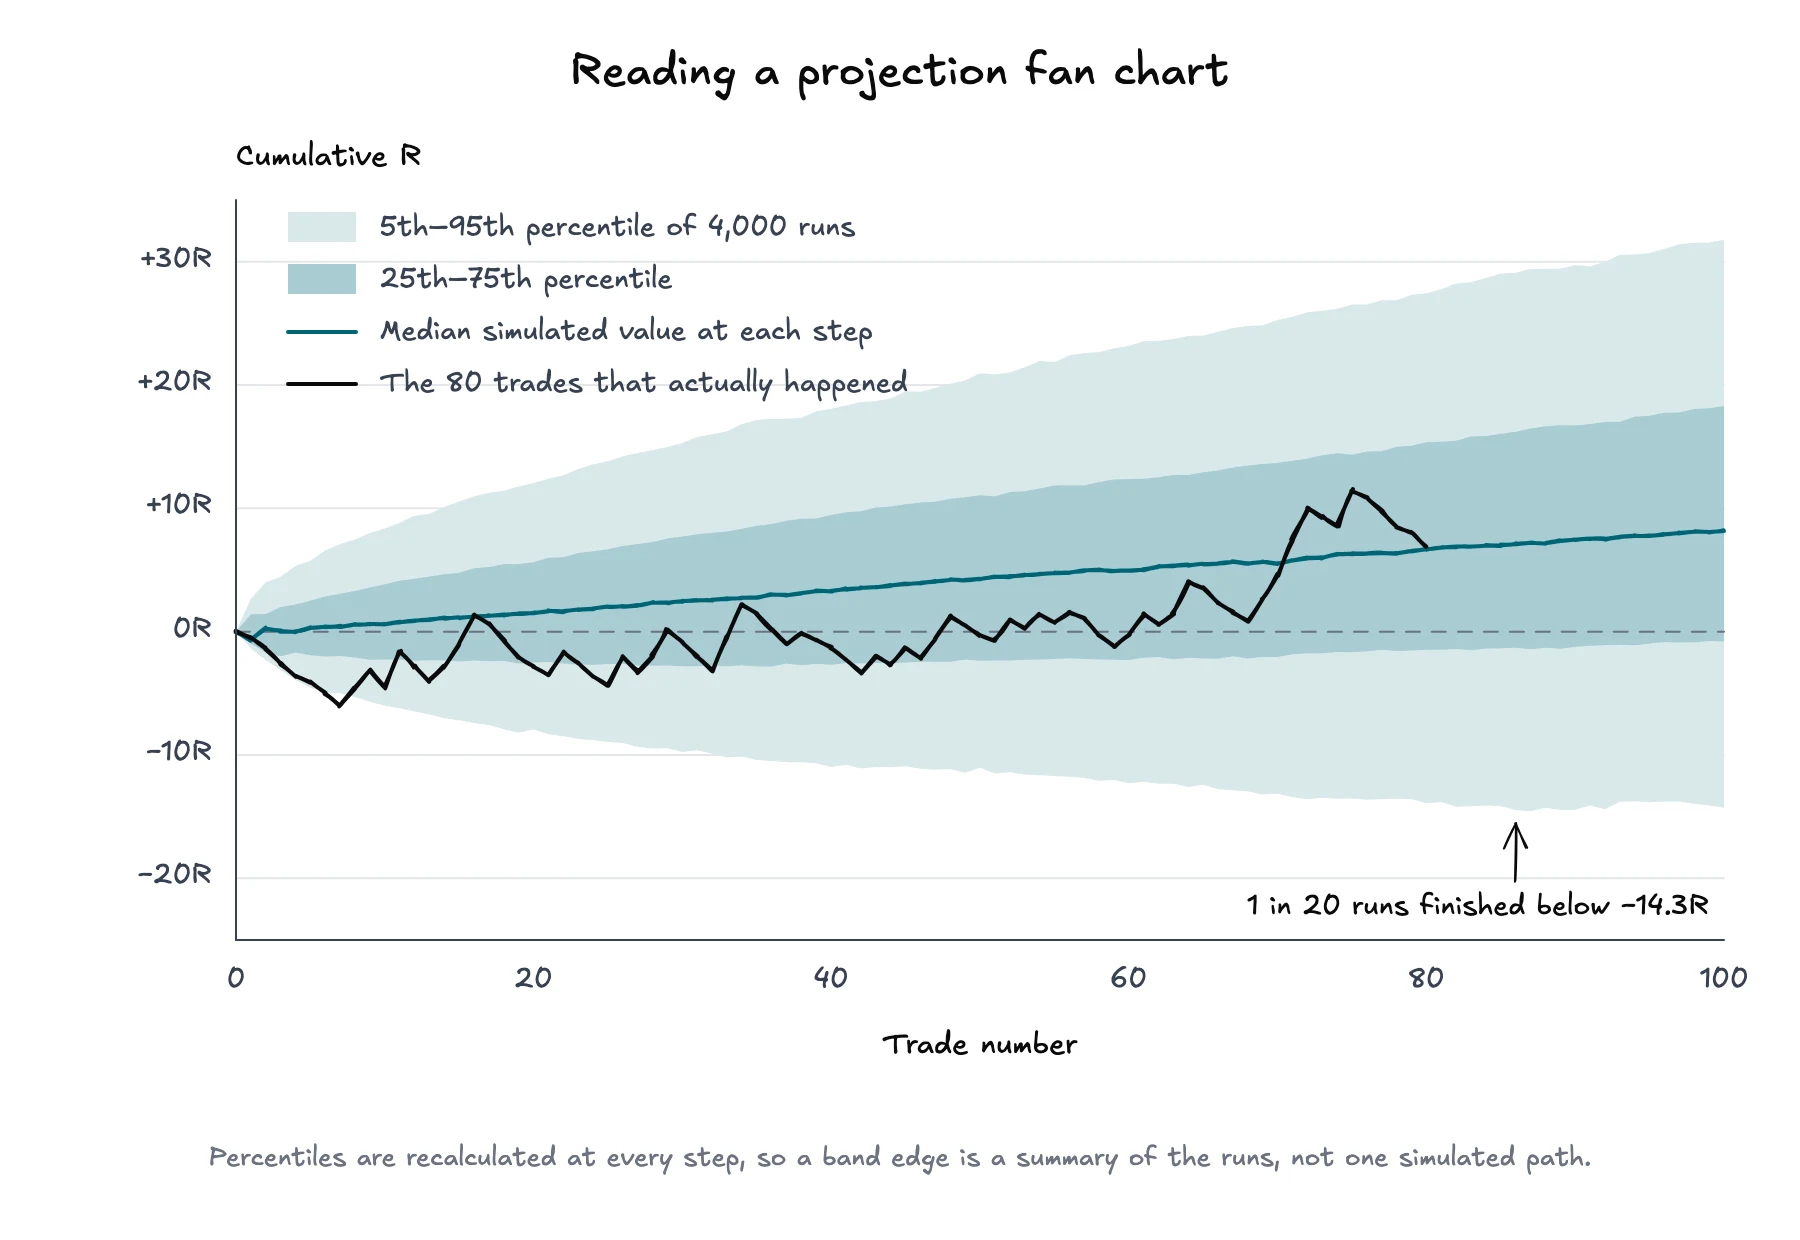
A fan chart plots trade count on the horizontal axis and cumulative outcome on the vertical axis. At each step, the simulation sorts all path values and marks percentiles. The median line is the middle simulated value. Wider bands, such as the 5th to 95th percentile range, show more of the simulated dispersion.
An illustrative projection: 4,000 runs of 100 trades drawn from a filtered history of 80. The median rises and the 5th percentile does not, from the same evidence.
Read the chart in three passes:
Read the center. The median shows the middle simulated outcome at each trade count. It is not the expected path and it is not a promise.
Read the width. A fan that widens quickly says the sequence produces a broad range of cumulative outcomes under the selected assumptions.
Compare the actual curve. The historical path shows where the realized sequence sits relative to the simulated range. A path near an outer band is unusual within this model, not proof that the strategy or execution was unusual for every possible model.
The percentile boundaries are calculated separately at every step. The 5th-percentile line is therefore not necessarily one continuous simulated path, and it does not mean there is a 95% chance that future equity will stay above it. It is a point-by-point summary of the runs.
The fan chart shows cumulative outcomes. The drawdown distribution answers a different question: how far did each simulated path fall from its own prior peak before recovering or ending?
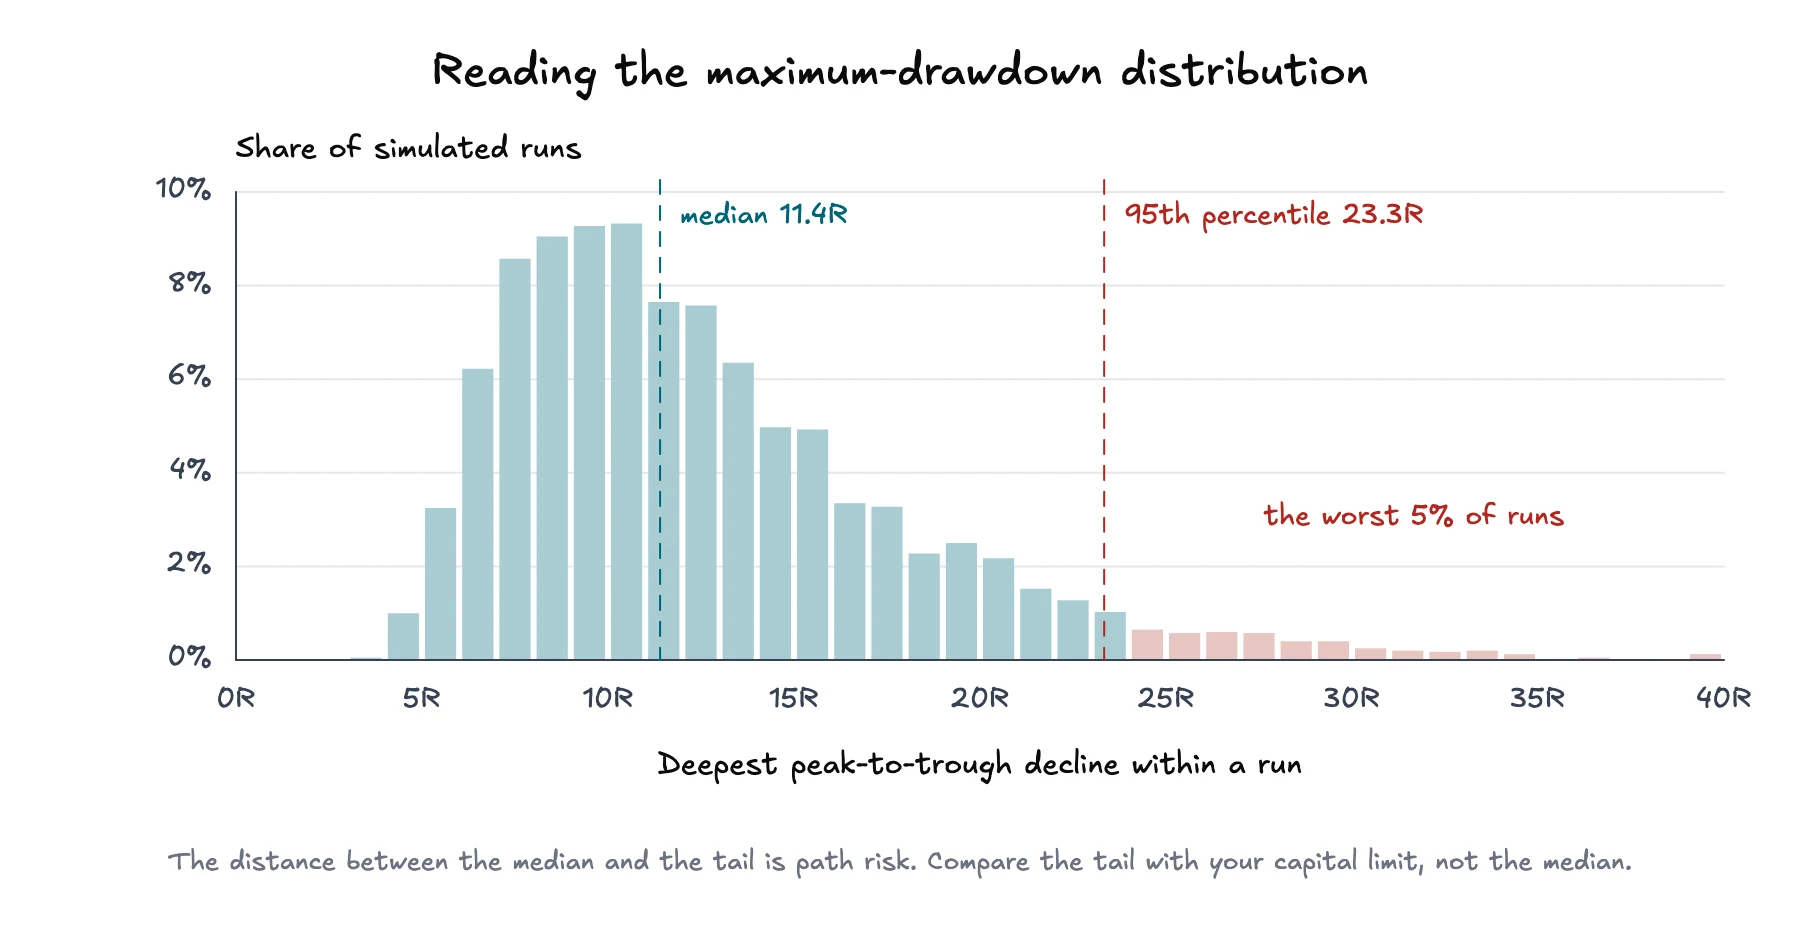
For every run, the simulation records that path's maximum peak-to-trough decline. The distribution then groups those maximum drawdowns. Its center describes a typical simulated worst decline, while the upper tail shows the deeper declines that occurred in fewer runs.
The same runs, a different question. The median worst decline is 11.4R; one run in twenty passed 23.3R.
Pay particular attention to the tail rather than only the average. A tolerable median drawdown can coexist with a much larger 95th-percentile drawdown. That gap is information about path risk. Compare it with your capital constraints and the point at which the strategy would no longer be executable as planned.
This is related to, but not the same as, risk of ruin. Drawdown measures peak-to-trough loss along a path. Ruin requires a defined capital threshold and asks how often a simulated path reaches it. The risk-of-ruin simulator is useful when you want to test hand-set win rate, payoff, trade risk, and capital assumptions; the Monte Carlo analysis uses the distribution in your filtered imported trade history.
Use the simulation as a comparison tool rather than a single score.
Select the account scope and filters that match the strategy or decision you are reviewing.
Check the sample before interpreting the output. Confirm that exclusions, missing values, and the number of matching trades are acceptable.
Run reshuffle mode first to separate total performance from ordering luck.
Read the maximum-drawdown tail and losing-streak range before the median final outcome.
Switch to projection mode, choose a horizon that matches the decision period, and inspect how quickly the fan widens.
Change one defensible filter at a time. If removing a market regime, setup, or account changes the distribution sharply, investigate why rather than selecting the result you prefer.
The simulation can tell you how sensitive the observed results are to sampling and order. It cannot validate the strategy's edge, repair biased input data, or choose a position size. Position sizing is a separate decision: the Kelly criterion describes a growth-optimal fraction under strong assumptions, while risk-of-ruin analysis focuses on the chance of crossing a capital threshold.
A Monte Carlo result supports statements that are conditional on its inputs: under this filtered sample, this mode, this horizon, and this number of runs, a given range appeared. It does not support statements that a future return or drawdown is guaranteed, that outcomes are independent, or that the filtered sample will remain representative.
That limitation is not a reason to discard the analysis. It is the reason to label the provenance, inspect the tails, and rerun the test when the underlying trade set changes. The value is not a more attractive equity curve. It is a clearer view of how much uncertainty the same trade evidence already contains.