Sortino ratio: how to calculate it from your daily P&L
The Sortino ratio divides your average daily result by the downside deviation of your losing days. Calculate it step by step, see why tools disagree on the number, and read it next to the Sharpe ratio.
We use cookies, including analytics, to improve Tradeways. · Privacy
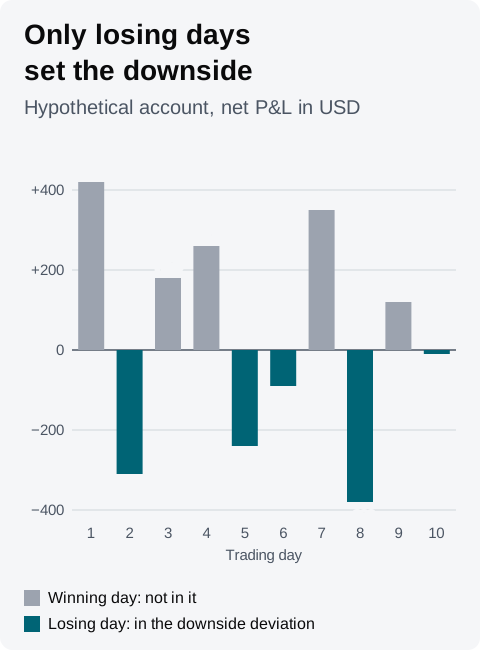
The Sortino ratio is your average daily result divided by your downside deviation, a measure of how large your losing days are. Unlike the Sharpe ratio, it ignores how far your winning days spread. To annualize it, multiply by √252. For example, ten days with an average of +30 USD and a downside deviation of 175.01 USD give 30 ÷ 175.01 × 15.87 = 2.72.
The same ten days can also produce 1.92, depending on how the downside deviation is averaged. This guide works one example both ways, compares it with the Sharpe ratio, and shows the convention Tradeways uses.
Sortino ratio = (average daily result − target) ÷ downside deviation × √252
Downside deviation = √(sum of squared shortfalls below the target ÷ n)
Here n is the number of days you count. Tools disagree on it, as the example shows.
List your daily net P&L, one value per day you traded. The average daily result is their sum divided by the number of days.
Pick a target. With a target of 0, every losing day is a shortfall. This guide uses 0, the target Tradeways uses.
Square each losing day's shortfall and add the squares.
Divide by n and take the square root. That is the downside deviation.
Divide the average daily result minus the target by the downside deviation, then multiply by √252 ≈ 15.87 to annualize.
The ratio has no unit, because the unit of the average cancels the unit of the downside deviation. Use one unit for every day: currency, R multiples, or a percentage of the account.
Both results above are calculated correctly. They differ in one choice: whether n counts every day or only the losing days.
As of 14 October 2026, the open-source PerformanceAnalytics library documents both in its downside deviation function: n is either the full series, its default, or only the returns below the target. As of 14 October 2026, its Sortino ratio function, which cites Sortino and Price (1994), divides the average return above the target by the downside deviation with its default all-periods divisor.
The two conventions differ by a fixed factor:
Losing-days-only result = all-days result × √(days below the target ÷ all days)
With 5 losing days out of 10, the factor is √0.5 = 0.707, and 2.72 × 0.707 = 1.92. With 3 losing days out of 10 it is 0.548, so the losing-days-only figure is little more than half the other.
Three more choices change the number:
Target: a target above 0 lowers the average above the target and turns small winning days into shortfalls. With the all-days divisor, that always lowers the ratio. With the losing-days-only divisor, the new small shortfalls can pull the downside deviation down, so the ratio can move either way.
Days: an average over the days you traded is further from 0 than one over every weekday, because days without trades count as 0.
Annualization: √252 assumes 252 days like the ones you measured. If you trade three days a week, the annualized figure describes a year in which you trade all 252 days, not the year you will trade.
Before you compare your figure with one from a spreadsheet, a broker report, or another period, check that both use the same divisor, target, days, and annualization.
The Sharpe ratio divides the same average by the standard deviation of all days, winning days included. The Sortino ratio divides it by the downside deviation of the losing days only. The standard deviations below are sample standard deviations, divided by n − 1, as Tradeways calculates them.
Account B below is hypothetical too. It has the same five losing days as the example and the same +1,330 USD of winning days. One +1,050 USD day replaces the example's spread of winning days, and the other four winning days make +70 USD each.
Measure
Example account
Account B
Average day
+30 USD
+30 USD
Standard deviation of all days
280.99 USD
397.13 USD
Sharpe ratio, annualized
1.69
1.20
Downside deviation, all days (n = 10)
175.01 USD
175.01 USD
Sortino ratio, all days, annualized
2.72
2.72
Sortino ratio, losing days only (n = 5), annualized
1.92
1.92
The Sharpe ratio fell from 1.69 to 1.20 because one large winning day widened the spread of results. The Sortino ratio did not move, because the losing days are the same.
Read the two together. If two periods have the same average day and the same losing days, but the Sharpe ratio is lower in one, the extra spread is in its winning days, as in account B. Neither ratio shows that account B made 1,050 of its 1,330 USD of winning-day profit on one day. If one day carries most of your profit, look at your best day's share of the total; the consistency rule guide shows how to calculate it.
No threshold for a good Sortino ratio carries over to your own daily P&L. A figure quoted for a fund can be built from monthly returns, with its own target and divisor, and the divisor alone moves the example from 2.72 to 1.92. Compare your ratio with your own earlier periods, calculated the same way.
The sign is the one part you can read on its own. With a target and a risk-free rate of 0, a ratio below 0 means your average day lost money.
Count your losing days before you trust the figure. The downside deviation rests only on them, so with a handful of losing days one more loss can move the ratio sharply. With no losing days there is nothing to measure, and the ratio has no value. That is a missing measurement, not an infinitely good result.
The Sortino ratio widget on a Tradeways dashboard, described in the widgets documentation, uses:
Days: the days in the dashboard's scope with closed trades, grouped by the day each trade closed in your Tradeways timezone. The card shows the day count, for example "10d · annualized".
Average: the mean of those days' P&L, in the dashboard's P&L display mode.
Downside deviation: losing days only. The sum of squared losing-day results is divided by the number of losing days, with a target of 0.
Annualization: √252.
Risk-free rate: set in the widget's settings, 0 by default. The widget subtracts the annual rate divided by 252 from the average day.
For the example account, with P&L shown in currency and a risk-free rate of 0, the widget shows 1.92, the losing-days-only figure. A spreadsheet that divides by all days shows 2.72 for the same ten days.
A risk-free rate is a percentage return, so it can only be subtracted from results that are also returns. Use it when the dashboard shows P&L as a percentage of the account. With P&L in any other unit, keep it at 0. The card shows "—" when the scope has no losing day.
The ratio describes past results and does not predict the next session. Read the Tradeways risk disclosure before you use it to support a trading decision.