Mga artikulo
Risk of ruin
Ang portfolio-level survival metric: ang probability na tatama ang account mo sa defined drawdown threshold bago magkaroon ng panahon ang edge mo na maglaro.
6 min na binasaTradeways#Panganib#Position sizing
Ang risk of ruin (RoR) ay ang probability na tatama ang account sa isang defined drawdown threshold bago magkaroon ng panahon ang statistical edge nitong maglaro. Ito ang portfolio-level companion ng per-trade MAE. Sinasabi sa iyo ng MAE kung gaano karaming heat ang kayang saluhin ng isang trade. Sinasabi sa iyo ng RoR kung gaano karaming heat ang kayang saluhin ng account bago ito tumigil maging account.
Ano talaga ang sinusukat ng risk of ruin
Ang RoR ay closed-form answer sa isang tanong: given ang edge, per-trade risk fraction, at drawdown threshold, ano ang probability na tamaan ang threshold? Dalawang desk na nagpapatakbo ng identical strategy ay maaaring nasa radikal na magkaibang RoR numbers. Ang strategy ang nagdedesisyon ng long-run profitability. Ang sizing ang nagdedesisyon ng survival.
Bawat edge ay nagpo-produce ng losing streaks. Ang 55% win-rate system ay nagtatapon pa rin ng runs na lima, anim, pitong sunod-sunod na losses, dahil iyon ang ginagawa ng independent Bernoulli process. Hindi defect ang streak. Ang defect ay ang pagkuha nito sa per-trade risk fraction na bumabasag sa drawdown threshold mo bago mag-mean-revert ang distribution.
Ang formula (Vince approximation)
Para sa fixed bet size na may normalized edge, ang standard approximation ay:
RoR = ((1 - Edge) / (1 + Edge)) ^ U
kung saan ang U ay ang bilang ng capital units sa pagitan ng current equity at ruin threshold (account size divided by risk per trade, scaled sa anumang drawdown na tinatawag mong ruin), at normalized ang edge para sa asymmetric payoffs:
Edge = (WR × RR − LR) / (WR × RR + LR)
kung saan ang WR ang win rate, LR ang loss rate, at RR ang average win divided by average loss (R-multiple). Ito ang Vince form. Para sa symmetric 1:1 outcomes, nagiging Edge = WR − LR ito. Ang closed form ang tamang tool para sa sizing decisions, hindi para sa precise tail estimates. Para sa non-normal return distributions, i-Monte Carlo ito.
Worked example. Strategy: 55% win rate, average win 1.5R, average loss 1R.
Edge = (0.55 × 1.5 − 0.45) / (0.55 × 1.5 + 0.45)
     = (0.825 − 0.45) / (0.825 + 0.45)
     = 0.375 / 1.275 ≈ 0.294
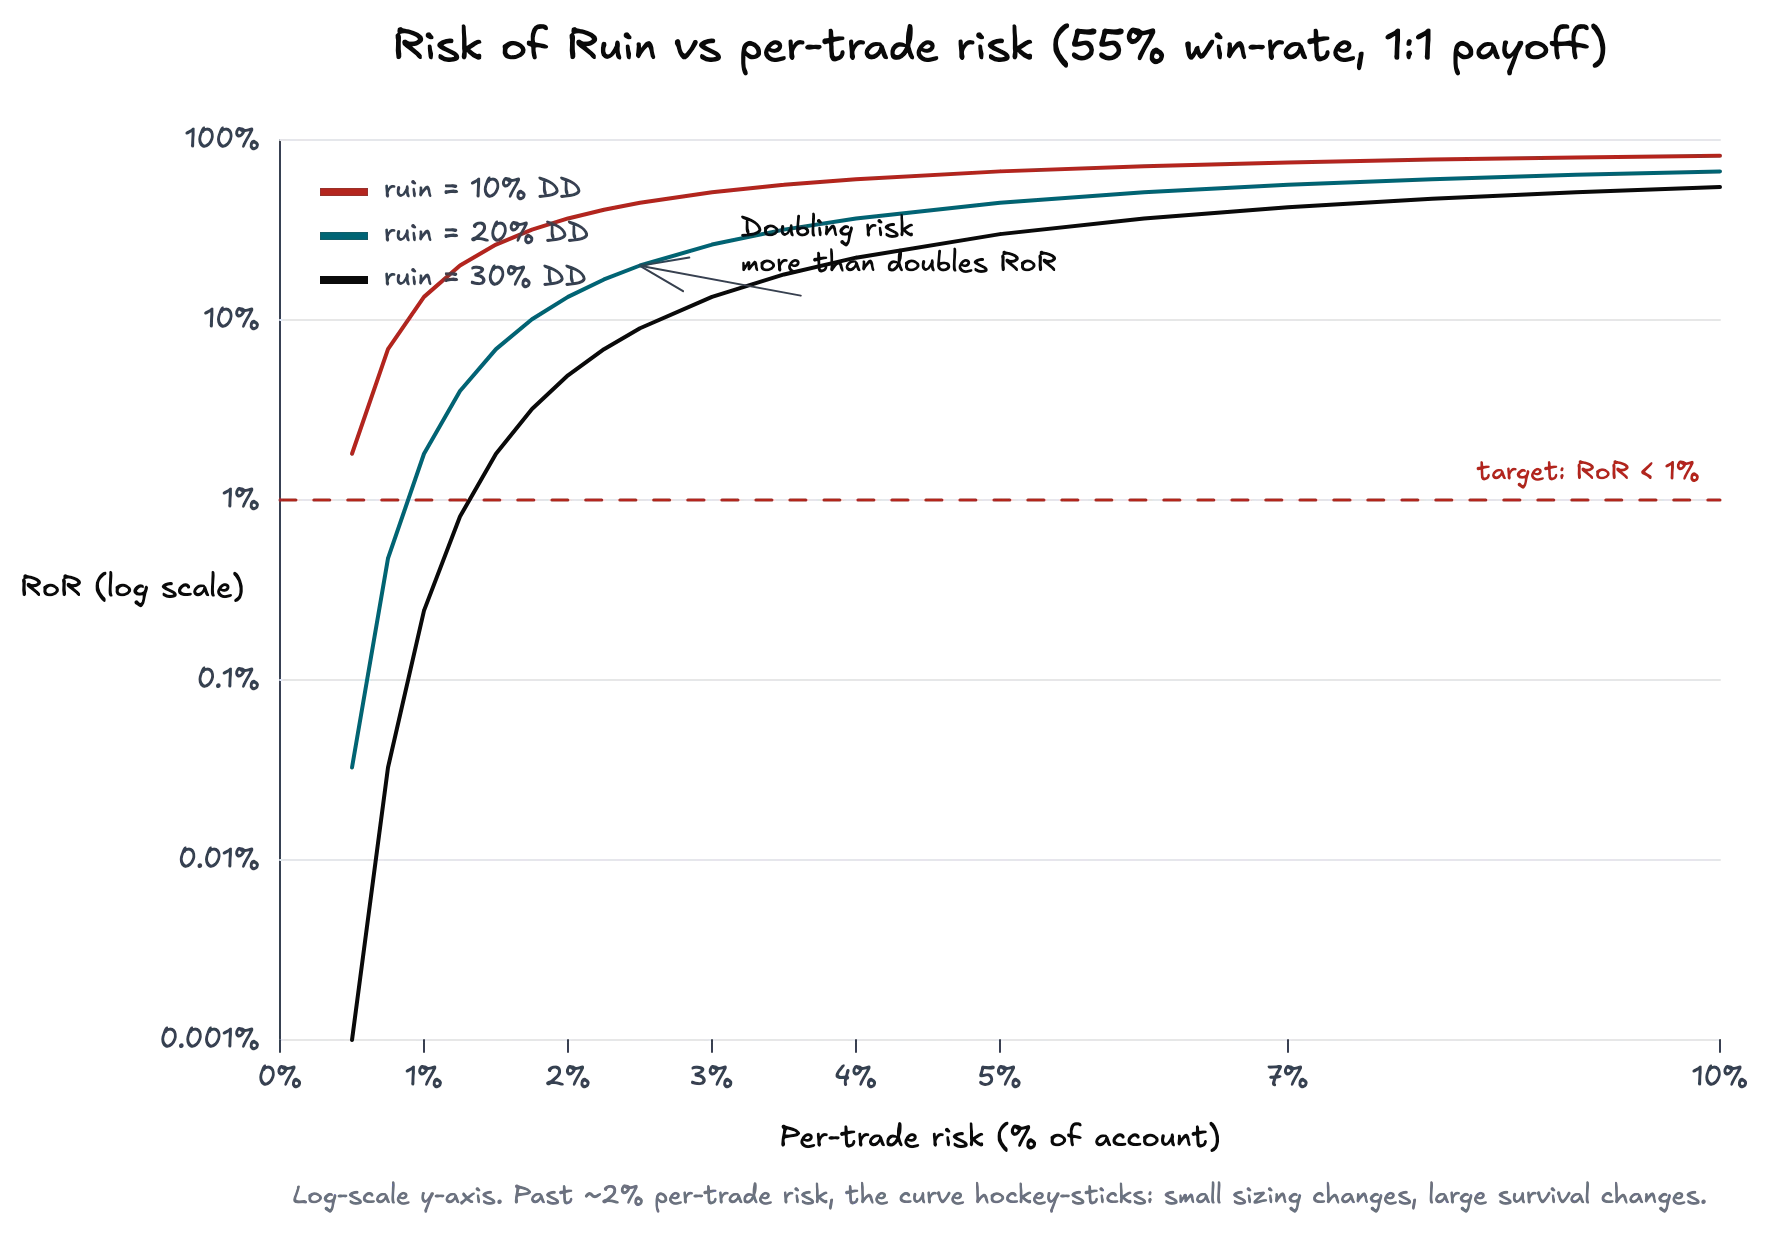
Sa 1% per-trade risk laban sa 20% drawdown threshold, U = 20 / 1 = 20 units, at RoR = (0.706 / 1.294)^20 = 0.5456^20 ≈ 0.05%. Ilipat ang per-trade risk sa 5%, U = 4, at RoR ≈ 8.9%. Hindi nagbago ang strategy. Bumagsak ang survival probability nang higit sa dalawang orders of magnitude.
Bakit non-linear ang curve
Ang pagdoble ng per-trade risk ay higit pa sa pagdoble ng RoR. Iyon ang buong punto ng chart.
Ang exponent sa formula ay ang bilang ng capital units hanggang ruin. Ang pagdoble ng risk ay naghahati sa units. Mas mababa sa one ang base, kaya ang paghati ng exponent ay square root, hindi simpleng paghati. Halos nagsa-square ang RoR sa bawat paghati ng U. Nananatiling malapit sa zero ang curve hanggang mga 1 hanggang 2% per-trade at pagkatapos ay matalim na yumuyuko pataas. Lampas 3%, kahit malalakas na edge ay nahihirapang panatilihing mas mababa sa 1% institutional ceiling ang RoR.
Paano nakakonekta ang RoR sa MAE
Hindi iisang numero ang risk na pinaplano mo at risk na kinukuha mo. Ang malapad na MAE distribution ay nangangahulugang regular na kumukuha ang trades ng mas maraming heat kaysa stop budget mo, dahil sa slippage, spread widening, o stops na nalalampasan sa news. Ang effective per-trade risk ay planned risk mo plus ang right tail ng MAE distribution mo. Kapag planned number ang ipinasok mo sa RoR, minamaliit mo ang ruin probability.
Dapat nasa parehong dashboard ang MAE at RoR. Ina-audit ng MAE per trade kung gaano kalinis talaga ang stops mo. Ang RoR ang portfolio-level consequence. Higpitan ang MAE at gumaganda ang RoR nang hindi binabago ang kahit isang sizing rule.
Praktikal na galaw: i-redefine ang "ruin"
Hindi zero balance ang ruin. Ang ruin ay ang drawdown na lampas doon ay hindi mo na kayang i-execute ang strategy. Para sa ilang traders, 30% iyon. Para sa karamihan ng professionals, mas malapit ito sa 20%. Para sa prop accounts, externally set ito, karaniwang 5 hanggang 10%.
Ang workflow ay i-fix muna ang drawdown threshold at i-back out ang per-trade risk. Ang pag-target ng RoR below 1% sa 0.29 edge at 20% drawdown threshold ay nangangahulugang pagsolve ng 0.5456^U = 0.01 para sa U, na nagbibigay ng U ≈ 7.6. Ang risk per trade ay nasa 20 / 7.6 ≈ 2.6%. Putulin ang threshold sa 10% at bababa ang max per-trade risk sa 1.3%. Putulin ang edge sa kalahati at kahit 1% per-trade ay magsisimulang magmukhang aggressive.
Ang inverted form na ito ang mahalaga sa practice. Hindi ka pumipili ng per-trade risk at tinitingnan kung anong RoR ang lalabas. Pinipili mo ang survival probability na kailangan mo at ang drawdown na kaya mong tiisin, pagkatapos ay binabasa mo ang per-trade risk.
Karaniwang maling basa
Ilang bitag ang lumalabas sa unang pagpapatakbo ng calculation na ito ng desks.
- Assuming independence. Ipinapalagay ng formula na independent ang trades. Ang correlated positions (tatlong NQ shorts sa parehong level, apat na FX longs laban sa USD) ay nagpapabagsak sa
Udahil nagkukumpulan ang losing trades. Tratuhin ang correlated positions bilang iisang sized unit, hindi maramihan. - Win rate without payoff. Mukhang safe ang 70% win rate hanggang matuklasan mong 0.5R ang average win at 1R ang average loss. Mas mahalaga ang R-multiple kaysa hit rate. Patakbuhin ang normalized edge, hindi ang raw win percentage.
- Pag-apply nito sa martingale at anti-martingale schemes. Ipinapalagay ng RoR sa form na ito ang fixed fractional sizing. Kung nagdo-double up ka pagkatapos ng losses o nag-scale into runners, hindi fixed ang bet size at hindi applicable ang closed form. I-simulate ang mga scheme na iyon; sistematikong magsisinungaling ang closed form.
- Paggamit ng backtest win rates. Sistematikong pinalalaki ng backtests ang WR sa pamamagitan ng slippage neglect, look-ahead bias, at overfit. Gumamit ng pessimistic win rate, ang uri na talagang na-produce ng huling 100 live trades mo.
Ano ang gagawin dito
Tatlong konkretong galaw kapag nasa dashboard na ang RoR.
Una, itakda ang survival target bago mo itakda ang position size. 1% RoR ang retail ceiling. 0.1% ang kinaroroonan ng professional desks. Anumang higit sa 5% ay structural problem na hindi maaayos ng entry refinement.
Ikalawa, patakbuhin ang inverted formula buwan-buwan. Nagdi-drift ang edge. Nabubulok ang strategies. Ang per-trade risk na safe noong nakaraang quarter ay maaaring hindi safe ngayon. I-recompute laban sa aktwal na edge ng huling 100 trades, hindi sa edge na naaalala mo noong bago pa ang strategy.
Ikatlo, ipares ang numero sa MAE. Sinasabi ng RoR lang kung ano ang sabi ng math. Sinasabi ng MAE kung gaano kalayo ang realidad mula sa math. Kapag naka-size laban sa effective risk sa halip na planned risk, nagiging tapat ang curve.
Mga kaugnay
Maximum Adverse Excursion (MAE)
Ang pinakamasamang unrealized loss na nalampasan ng isang trade — at kung ano ang sinasabi ng MAE distribution tungkol sa kung tunay na gumagana ang stops.
4 min na binasa
Pagbasa ng MFE, MAE, at MCE
Tatlong numero ang naglalarawan sa bawat closed trade: ang pinakamaganda nitong naabot, ang pinakamasamang banta nito, at ang ginawa nito pagkatapos mong lumabas. Magkasama, sinasabi ng mga ito kung structural o lucky ang exit mo.
3 min na binasa
Maximum Favorable Excursion (MFE)
Ang pinakamahusay na unrealized profit na naabot ng isang trade bago mo ito isinara — at kung ano ang sinasabi ng gap sa realized P&L tungkol sa exits.
4 min na binasa