نستخدم ملفات تعريف الارتباط، بما في ذلك التحليلات، لتحسين Tradeways. · الخصوصية
أقصى حركة عكسية (MAE) هي أدنى P&L سعري محسوب بلغته الصفقة أثناء فتحها، مع الصفر قيمة بداية أساسية. تبيّن إلى أي مدى تحرك المركز ضدك قبل أن تغلقه، سواء انتهت الصفقة بربح أو بخسارة.
تكون MAE أنفع إلى جانب Stop Loss الذي خططت له عند الدخول. اقسم حجم MAE على مسافة Stop Loss المخطط لها لترى كم استهلكت الصفقة من المخاطرة المخطط لها. ثم قارن هذه النسبة عبر صفقات لها Setup واحد لتحدد ما إذا كان عليك مراجعة الدخول أو موضع Stop Loss. ونظيرها في الجانب المواتي هو أقصى حركة مواتية.
MAE هي أدنى نقطة بلغها P&L السعري للصفقة بين الدخول والخروج.
يعيد Tradeways تتبع عمليات تنفيذ الصفقة على أشرطة سعرية بدقة ثانية واحدة. ولكل شريط أثناء فتح المركز، يقيّم P&L السعري عند القيمة العكسية القصوى للشريط: أدنى سعر في صفقة Long، وأعلى سعر في صفقة Short. ويقيّم أيضًا سعر كل عملية تنفيذ. وMAE هي أدنى هذه القيم.
ثلاث تفاصيل تغيّر طريقة قراءة الرقم:
تبدأ MAE من الصفر ولا تكون موجبة أبدًا. صفقة Long لم تتداول يومًا تحت سعر دخولها، أو صفقة Short لم تتداول فوقه، قيمة MAE فيها 0.
الزيادة التدريجية في المركز والتخفيض التدريجي منه مشمولان. يضيف الحساب P&L السعري المحقق من الكميات التي أغلقتها بالفعل إلى P&L المتغير للكميات التي لا تزال مفتوحة. في صفقة بها خروج جزئي، قد لا يكفي أدنى سعر على المخطط وحده لإعادة حساب MAE.
MAE قائمة على السعر. الرسوم والتعديلات ليست من مدخلاتها. قارنها بمسافات سعرية، مثل مسافة Stop Loss، لا بصافي النتيجة بعد الرسوم.
تعرض تفاصيل الصفقة قيمة MAE مع الوقت الذي بلغتها فيه بعد الدخول. ويضم سجل الصفقات عمود MAE. وبحسب وضع العرض لديك، تظهر MAE بوحدة Tick أو بالمال؛ وفي الحالتين تشمل المركز كله، لا وحدة واحدة.
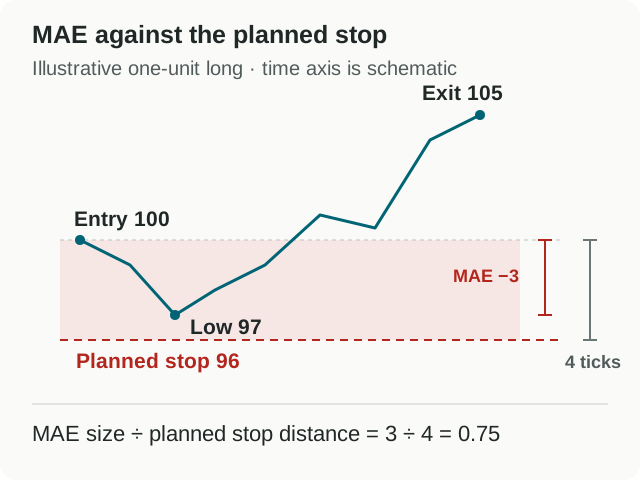
تأمل صفقة Long توضيحية. تستخدم وحدة واحدة وحجم Tick يساوي وحدة سعرية واحدة ودون رسوم.
الدخول عند 100، مع Stop Loss مخطط له عند 96: أربع Tick من المخاطرة المخطط لها.
أدنى سعر أثناء فتح الصفقة 97، بُلغ بعد دقيقتين من الدخول.
بقي Stop Loss عند 96 طوال الصفقة.
الخروج عند 105.
صفقة توضيحية. يمثل الشريط المظلل المخاطرة المخطط لها. استهلكت MAE ثلاث Tick من أصل أربع مخطط لها قبل أن تتحرك الصفقة في صالحك.
القياس
الحساب
النتيجة
MAE
97 − 100
−3
مسافة Stop Loss المخطط لها
100 − 96
4
حجم MAE ÷ Stop Loss المخطط له
3 ÷ 4
0.75
P&L السعري المحقق
105 − 100
+5
أُغلقت الصفقة بربح خمس Tick، واستهلكت أولًا ثلاثة أرباع مخاطرتها المخطط لها. تجيب النتيجة وMAE عن سؤالين مختلفين: تبيّن النتيجة كيف انتهت الصفقة، وتبيّن MAE إلى أي مدى اقتربت من Stop Loss الذي خططت له.
في مركز أكبر من وحدة واحدة، قارن قيمًا من النوع نفسه. تشمل MAE المركز كله، فقارنها بمسافة Stop Loss مضروبة في الكمية، أو قارن القيم المالية.
لا تستطيع صفقة واحدة أن تخبرك ما إذا كان Stop Loss في موضعه الصحيح. اجمع صفقات Setup واحد بقاعدة Stop Loss نفسها واحسب النسبة لكل صفقة. الصفقات الخمس أدناه توضيحية وتستخدم Stop Loss مخططًا له بأربع Tick لكل منها.
الصفقة
MAE
حجم MAE ÷ Stop Loss المخطط له
P&L السعري المحقق
A
−3
0.75
+5
B
−1
0.25
+4
C
−4
1.00
−4
D
0
0.00
+6
E
−3
0.75
+2
بلغت الصفقة C مستوى Stop Loss وأُغلقت عنده، وهذا هو الغرض من Stop Loss المخطط له. استهلكت صفقتان من الصفقات الرابحة الأربع، A وE، ثلاثة أرباع المخاطرة المخطط لها قبل أن تنجحا. أما الصفقة D فلم تتداول يومًا تحت سعر دخولها.
خمس صفقات أقل من أن تغيّر قاعدة. ومع نمو عينة Setup نفسه، انظر أين تتجمع النسب في الصفقات الرابحة:
ما تراه في النسب
ما الذي تفحصه
كثير من الرابحة قريبة من 1.0
توقيت الدخول والمستوى الذي يستند إليه Stop Loss. تحقق مما إذا كانت الدخولات قد سبقت محفز الـ Setup، وما إذا كان Stop Loss في الموضع الذي يبطل عنده الـ Setup.
الرابحة غالبًا أقل بكثير من 1.0، والخاسرة عند 1.0
ما إذا كان Stop Loss أوسع مما يحتاج إليه الـ Setup. اختبر قاعدة Stop Loss مختلفة على صفقات سابقة قبل تغييرها، وسجّل أن الاختبار افتراضي.
أي صفقة فوق 1.0
سجل Stop Loss وتنفيذ الخروج في تلك الصفقة. تجاوز المركز Stop Loss المخطط له. ابحث عن السبب، مثل Stop Loss جرى تحريكه أو إزالته، أو خروج جرى تنفيذه بعد Stop Loss، أو مركز مضاف غيّر الكمية. ولأن MAE تستخدم أشرطة بدقة ثانية واحدة، فقد يتداول الشريط الذي يضم الخروج أيضًا بعد سعر التنفيذ بقليل.
نسب موزعة بالتساوي بين 0 و1
سبب محتمل: الصفقات لا تشترك في Setup واحد وقاعدة Stop Loss واحدة. تحقق من ذلك قبل قراءة هذا التوزيع على أنه خاصية للـ Setup.
هذه أسئلة للمراجعة، لا أحكام. الصفقة الرابحة ذات النسبة العالية ليست دليلًا على دخول سيئ، والنسبة المنخفضة ليست دليلًا على دخول جيد.
اقرأ سجل Stop Loss. أي Stop Loss جرى تحريكه أو استبداله أو إزالته أثناء فتح الصفقة يغيّر المسافة المخطط لها التي تقارن بها. استخدم Stop Loss الذي خططت له عند الدخول، وسجّل أي تغيير بشكل منفصل.
افتح شرح MAE وافحص نافذته الزمنية ومصدر بياناته. النتيجة قيد الحساب أو غير المتاحة ليست صفرًا؛ استبعدها من المقارنة حتى تُقاس.
في صفقة بها خروج جزئي، تأكد من عمليات التنفيذ. تشمل MAE P&L السعري المحقق من الكميات المغلقة بالفعل.
انظر متى بلغت MAE. الصفقة التي بلغت MAE في الثواني الأولى بعد الدخول تطرح سؤال مراجعة مختلفًا عن صفقة بلغتها قبيل الخروج.
للصفقة A أعلاه، يمكن أن تُكتب ملاحظة مفيدة كما يلي:
صفقة Long بوحدة واحدة، دخول عند 100، وStop Loss مخطط له عند 96، وخروج عند 105. MAE سالب 3، بُلغت بعد دقيقتين من الدخول: 0.75 من المخاطرة المخطط لها. Stop Loss دون تغيير عند 96.
استهلكت الصفقتان الرابحتان A وE في هذا الـ Setup 0.75 من Stop Loss. المراجعة التالية: أجمع صفقات أكثر بالـ Setup نفسه وقاعدة Stop Loss نفسها، وأتحقق مما إذا كانت الصفقات الرابحة ذات النسبة العالية قد دخلت قبل إغلاق شمعة المحفز.
اختر صفقة مغلقة واحدة واستخدم دليل تفاصيل الصفقة لقراءة MAE والوقت الذي بلغتها فيه وسجل Stop Loss. ولمعرفة كيف تتكامل MAE مع MFE ومع الحركة بعد خروجك، اقرأ نظرة MFE وMAE وMCE.