Artikelen
Maximum Favorable Excursion (MFE)
De beste ongerealiseerde winst die een trade bereikte voordat je hem sloot — en wat het verschil met gerealiseerde P&L je vertelt over exits.
4 min leestijdTradeways#Metrics#Playbook
Maximum Favorable Excursion (MFE) is de beste ongerealiseerde winst die een trade bereikt tussen opening en sluiting. Het wordt uitgedrukt in geld, niet in punten, zodat je een tick-scalp en een swing van meerdere uren op dezelfde as kunt vergelijken. Leg je alleen gerealiseerde P&L vast, dan gooi je de helft weg van wat elke trade je vertelt.
Wat MFE daadwerkelijk meet
MFE is het hoogtepunt van je open P&L-curve terwijl de positie actief was. Neem elke prijs tussen je fill en je sluiting, markeer de prijs die je op dat moment de grootste winst had opgeleverd — dat is je MFE. In het Tradeways journal berekenen we het op basis van 1-seconde OHLCV-bars afkomstig van Databento, waarbij elke bar in het venster wordt gescand. Alles grover (1 minuut, 5 minuten) onderschat de piek systematisch.
'Tussen entry en exit' is bepalend. MFE telt alleen bars mee waarbij de positie open was. De beweging die plaatsvond nadat je hebt gesloten is een andere metric, Maximum Continuation Excursion. De twee door elkaar halen is de meest gemaakte beginnersfout.
Twee praktische opmerkingen. MFE wordt opgeslagen in geld (ticks in jouw voordeel keer tick-waarde), dus 4 ticks op NQ en 4 ticks op ES zijn niet hetzelfde getal. Bij shorts is MFE de laagste bereikte prijs, gespiegeld naar positief geld. De semantiek is altijd 'het beste voor de positie die je daadwerkelijk hield'.
Wat het verschil met gerealiseerde P&L je vertelt
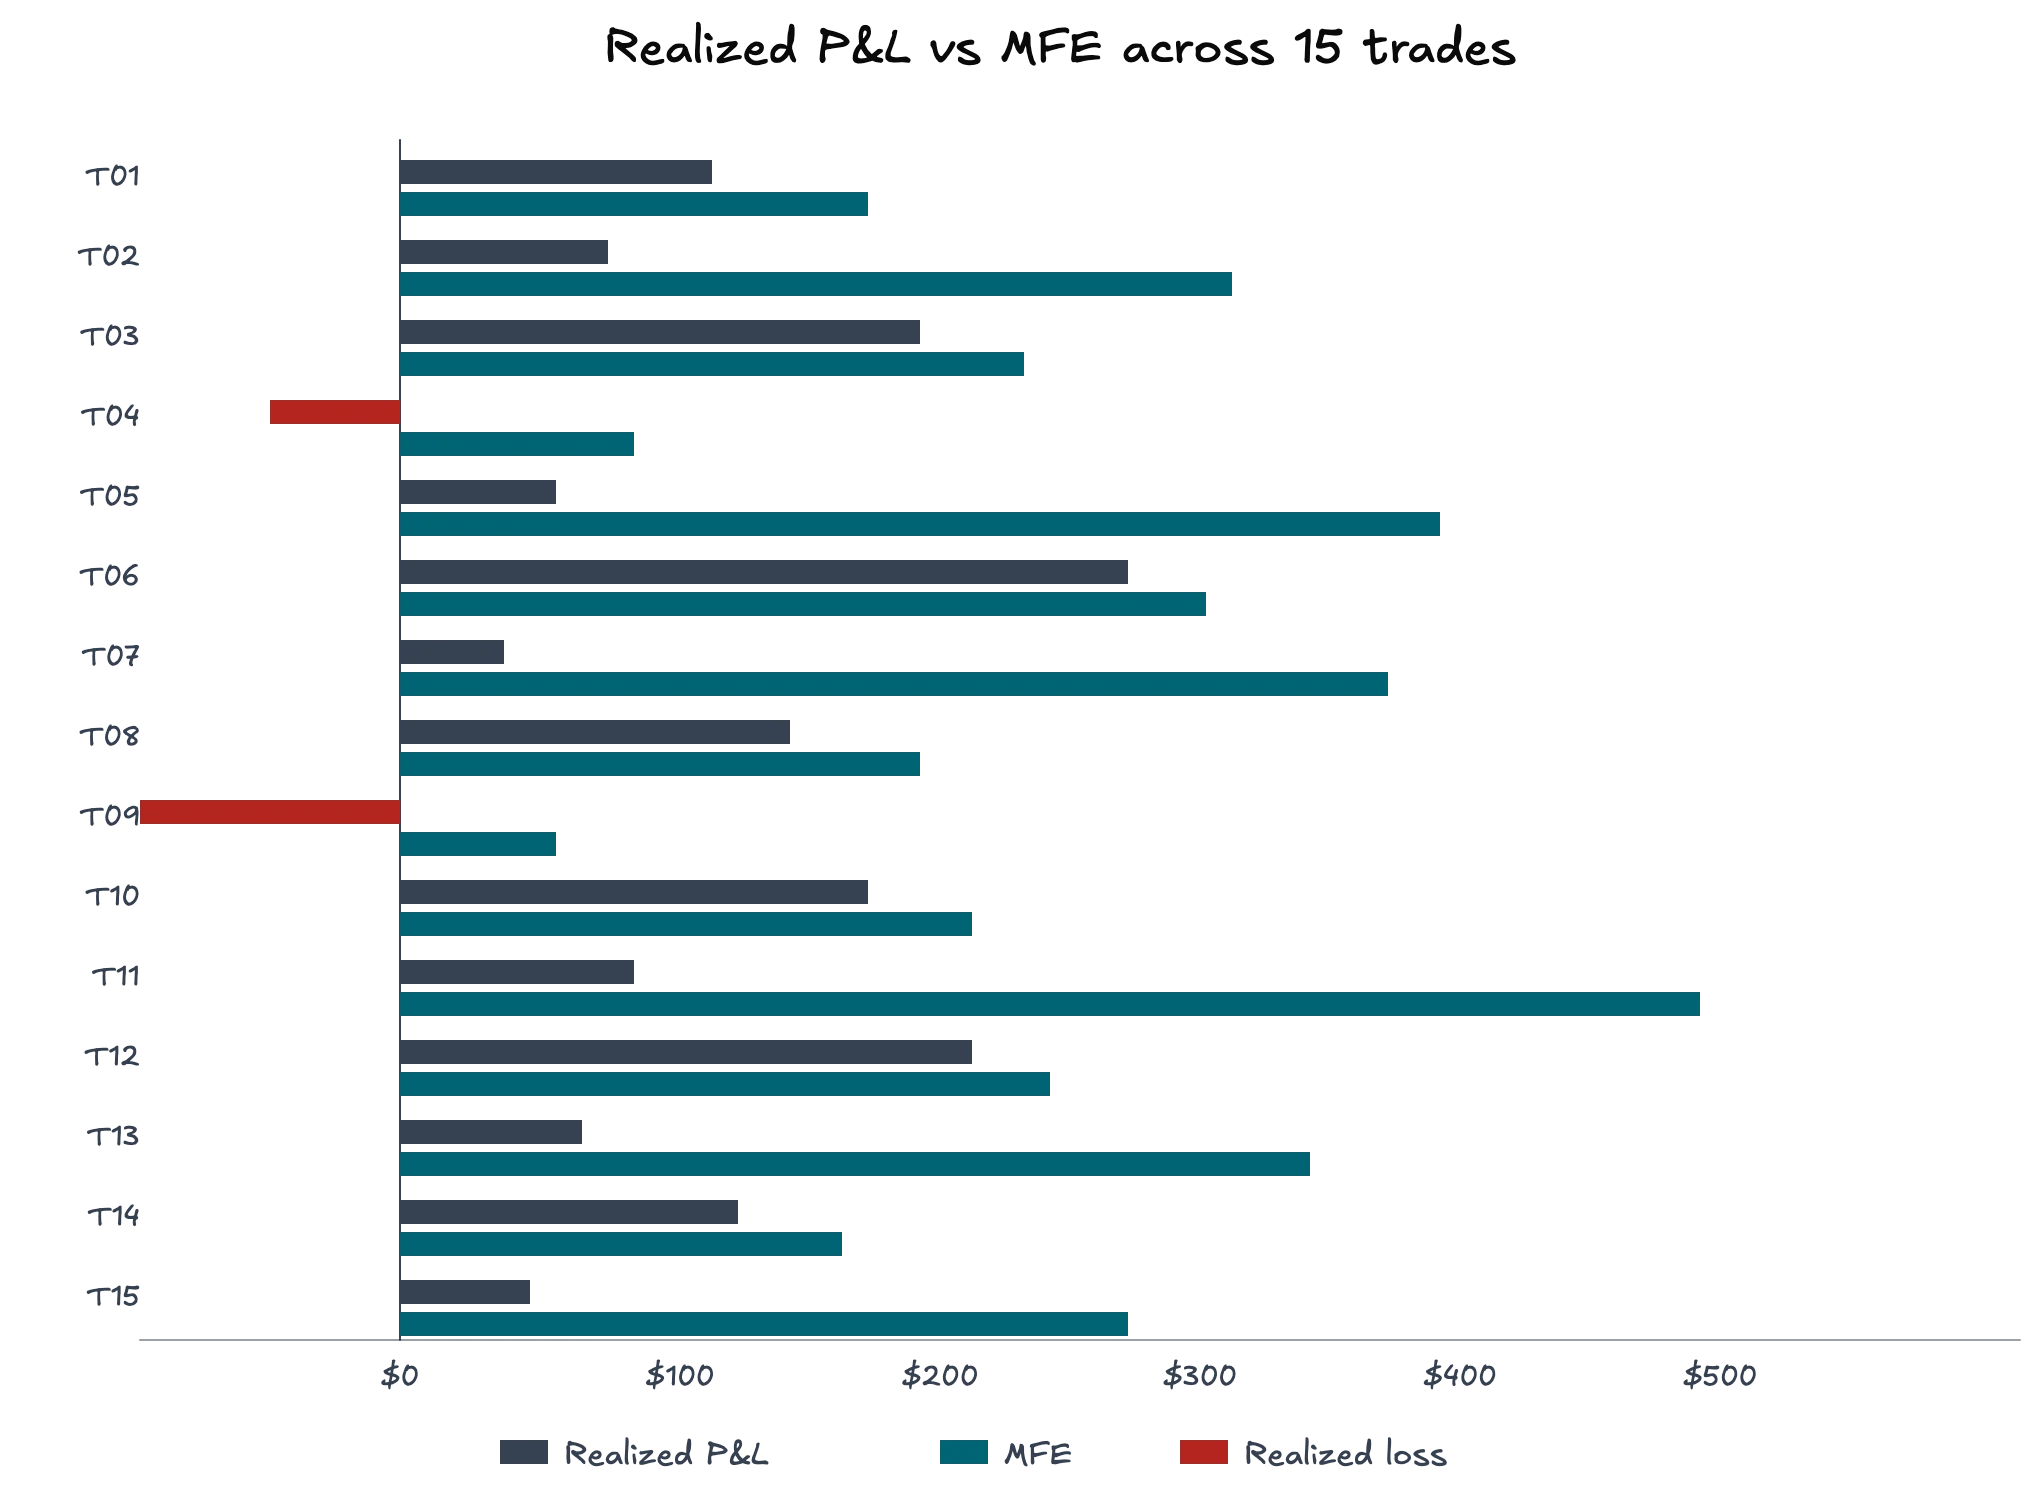
Het signaal zit in het verschil, niet in het getal op zichzelf. Gerealiseerde P&L is wat je hebt geboekt. MFE is wat beschikbaar was. Het verschil is het deel van de beweging dat je op het scherm zag maar niet hebt meegenomen.
Als MFE ver boven gerealiseerd zit op een winnende trade, was de beweging er en heeft je exit-logica hem laten lopen. Als MFE en gerealiseerd dicht bij elkaar liggen, heb je de beweging goed vastgehouden. Bij een verliezende trade is een hoge MFE een ander verhaal: de trade stond in de winst en je hebt hem laten round-trippen. Tag die apart, want de oplossing is psychologisch, niet analytisch.
Hoe je het leest bij één trade tegenover een reeks
Bij één trade is MFE anekdotisch. Misschien piekte de markt een seconde voor je exitde, misschien niet. Eén MFE-uitbijter met een hoge waarde bewijst niets over je exits.
Over 50 of meer trades van dezelfde setup verandert het beeld. De verdeling van realized / MFE wordt een structurele eigenschap van je exit-regels. Een setup met een gemiddelde van 0,35 is een setup waarbij je target op de verkeerde plek staat. Een setup met een gemiddelde van 0,85 is er een om op te schalen in plaats van aan te sleutelen.
MFE, MAE en MCE alle drie samen bekijken geeft je het volledige beeld. MFE alleen beantwoordt één vraag: of je geld op tafel laat liggen tijdens de hold.
Veelgemaakte vergissingen
Een aantal valkuilen die regelmatig opduiken wanneer traders voor het eerst MFE beginnen bij te houden:
- Stop-loss exits. Als de trade je stop raakte, is MFE doorgaans klein en vertelt het je weinig. Filter deze eruit wanneer je exitkwaliteit bestudeert.
- Trades zonder target. MFE gaat uit van een target dat je realistisch gezien kon bereiken. Als het plan een trailing exit was, vergelijk dan met de trail, niet met de globale piek.
- Te weinig trades. Tien trades zijn geen verdeling. Wacht op 50 afgesloten trades in dezelfde setup voordat je conclusies trekt.
- MFE verwarren met MCE. MFE stopt bij je exit. De beweging daarna is Maximum Continuation Excursion.
- Instrumenten zonder aanpassing vergelijken. 200 dollar op CL is niet 200 dollar op MES. Gebruik ticks-in-favor of R-multiples wanneer je instrumenten vergelijkt.
Wat je ermee doet
Drie concrete stappen zodra MFE in je journal staat naast elke afgesloten trade.
Ten eerste, log het automatisch. Als je het handmatig moet invoeren, stop je ermee. Het Tradeways journal berekent het bij sluiting op basis van de 1-seconde feed, zodat het getal er staat voordat je je notities schrijft.
Ten tweede, bekijk de verdeling van realized / MFE over je laatste 50 trades, opgesplitst per setup. Sorteer setups op mediaanratio. De onderkant van die lijst is waar je exits het meest lekken, en het is het goedkoopste onderdeel van je proces om te verbeteren, omdat de entry al werkt.
Ten derde, wanneer een setup een dikke rechterstaart toont (hoge MFE, lage capture), open dan drie van die trades en bekijk de grafiek op je exitmoment. Bijna altijd herhaalt hetzelfde patroon zich: eerste pullback, eerste ronde getal, eerste volumecluster. Dat is een regel die je kunt opschrijven en testen.
Het complement is de verlieskant, Maximum Adverse Excursion. MFE vertelt je hoeveel van de beweging je hebt meegenomen. MAE vertelt je hoeveel heat je hebt doorstaan om dat te bereiken. Je wilt beide getallen bij elke trade.
Gerelateerd
Maximum Continuation Excursion (MCE)
Wat deed de markt nadat je sloot? MCE meet de beweging die je miste — en laat zien of je exit op tijd was of te vroeg.
6 min leestijd
MFE, MAE en MCE begrijpen
Drie cijfers beschrijven elke afgesloten trade: het beste resultaat, de ergste dreiging en wat er na je exit gebeurde. Samen vertellen ze of je exit structureel was of gelukkig.
3 min leestijd
Maximum Adverse Excursion (MAE)
Het ergste ongerealiseerde verlies dat een trade overleefde — en wat je MAE-verdeling zegt over of je stops echt werk doen.
3 min leestijd