Profit factor: calculate it and check what drives it
Profit factor is gross profit divided by gross loss. Work through an example, decide how fees and breakeven trades count, and test whether one trade drives the ratio.
We use cookies, including analytics, to improve Tradeways. · Privacy
Profit factor is gross profit divided by gross loss. Gross profit is the sum of your winning trades. Gross loss is the sum of your losing trades, taken as a positive number. A profit factor of 1.5 means the winning trades in that sample added up to 1.5 times what the losing trades took away.
The ratio depends on which trades you include, whether results are before or after fees, and how you treat trades that ended flat. Define those three things first. Then check whether a single trade carries the result.
Choose the sample: the account, period, strategy, and closed trades you want to measure.
Decide whether you use results before or after commission and other fees. Use one basis for every trade.
Add the results of the winning trades. That is gross profit.
Add the results of the losing trades and drop the minus sign. That is gross loss.
Divide gross profit by gross loss.
Here is a hypothetical sample of 20 closed trades in a US dollar account. The results are after commission.
Group
Trades
Combined result after commission
Winning trades
8
+$2,400
Losing trades
10
−$1,600
Zero-result trades
2
$0
Total
20
+$800
Profit factor is 2,400 ÷ 1,600 = 1.50. The two zero-result trades are neither wins nor losses, so they do not enter either sum.
You can reach the same number from averages. The average win is $2,400 ÷ 8 = $300 and the average loss is $1,600 ÷ 10 = $160. Then (8 × $300) ÷ (10 × $160) = 1.50. This is why profit factor moves with both your win rate and your average win and average loss.
Above 1: the winning trades summed to more than the losing trades in this sample.
Exactly 1: the two sums cancel.
Below 1: the losing trades summed to more than the winning trades.
No losing trades: gross loss is zero and the ratio is undefined. It is not a very large profit factor. Tradeways shows a dash in this case.
The ratio describes the sample you chose. It does not tell you what the next trades will return, and a small sample can produce a high or low value from a few results. Note the trade count next to every profit factor you record.
Profit factor and trading expectancy use the same trades but answer different questions. Expectancy is the average result per trade, including flat trades. Profit factor is a ratio of the two sums, so it does not show the size of the result per trade. If every result in the example doubled, profit factor would stay 1.50 while the average result would double from $40 to $80 per trade.
The same 20 trades produce different ratios depending on the choices above.
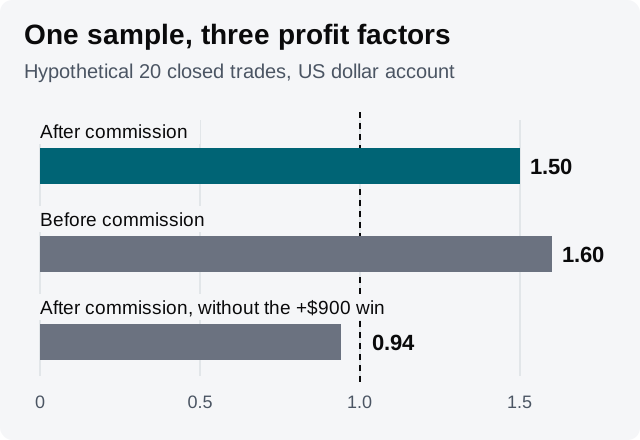
Fees. Suppose each trade in the example paid $6 in commission. Before commission, the eight winning trades total $2,448 and the ten losing trades total $1,540. Every loss in the example is larger than $6, so each one stays a loss on that basis. Each of the two zero-result trades was +$6 before commission, so it counts as a win on that basis. Gross profit becomes $2,460 and profit factor becomes 2,460 ÷ 1,540 = 1.60. Both values are correct for their basis. Comparing a before-commission ratio with an after-commission ratio is not.
One large trade. The largest winning trade in the example is +$900. Remove it and gross profit falls to $1,500. Profit factor becomes 1,500 ÷ 1,600 = 0.94. In this sample, one trade moves the ratio from above 1 to below 1. Record that alongside the 1.50, because the ratio alone does not show it.
Hypothetical sample. The trades are the same in every bar; only the fee basis or the removal of one trade changes the ratio.
Run the same check on your largest losing trade. If the example's largest loss is −$400, removing it raises profit factor to 2,400 ÷ 1,200 = 2.00. When removing one trade on either side changes your conclusion, the conclusion rests on that trade. Write that down with the ratio.
The Profit Factor dashboard widget shows the ratio with its gross profit and gross loss underneath. To compare it with your own calculation:
Select the account and set the global filter to the period, strategy, or symbols in your sample. The widget counts closed trades only.
Keep the P&L display in Currency, the default mode. Currency mode deducts commission, so gross profit in the widget is the sum of winning trades after commission. Other display modes express P&L in different units and can produce a different ratio. The P&L modes documentation lists them.
Check your breakeven threshold. Tradeways classifies a trade at or inside the threshold as breakeven and leaves it out of both sums. A trade at −$4 under a $5 threshold still reduces your net P&L, but it does not count as a loss in profit factor. The breakeven threshold documentation explains the account and global settings.
For the one-trade check, add the Largest Win/Loss widget with the same account and filter. Subtract its largest win from the Profit Factor widget's gross profit and divide again.
To compare strategies, add a widget filter for one strategy. Layer combines it with the dashboard filter; Replace ignores the dashboard filter. The widget documentation explains both modes.
A dash in the widget means the scope has no losing trades, so no ratio exists. It is not zero, and it is not a strong result.
Profit factor and expectancy are two views of the same trades. Use the trading expectancy calculator for the average result per trade. To compare strategies with different volatility, the Sharpe ratio measures return against its variation.
Use Tradeways dashboards to keep profit factor and its gross profit and gross loss in view for the sample you defined. Historical metrics do not predict future results; read the risk disclosure.