Simulação de Monte Carlo para resultados de trading
Entenda como as simulações de projeção e reordenação transformam seu histórico de trades em gráficos de leque, faixas de Drawdown e perguntas de risco que podem ser testadas.
Usamos cookies, incluindo os de análise, para melhorar o Tradeways. · Privacidade
Sua curva de capital histórica mostra uma sequência de resultados: a sequência que aconteceu. Uma simulação de Monte Carlo pergunta como as mesmas evidências poderiam aparecer em muitos caminhos alternativos. Ela não melhora os trades nem prevê o mercado. Ela mostra o quanto a ordem e a repetição de resultados passados podem mudar o caminho que você teria de percorrer ao operar.
Essa diferença torna a simulação útil para uma tarefa concreta: testar se a aparente estabilidade de uma estratégia depende de uma sequência favorável. O resultado é uma faixa de resultados condicionais, não uma previsão.
Um trader pode fazer duas perguntas diferentes a um histórico de trades:
Projeção: Qual faixa de resultados poderia ocorrer se resultados semelhantes aos desta amostra filtrada voltassem a acontecer no próximo conjunto de trades?
Reordenação: Quão diferente o caminho poderia ter sido se estes mesmos trades tivessem ocorrido em outra ordem?
Os modos usam os mesmos dados de origem, mas respondem a perguntas diferentes. Tratá-los como equivalentes é a forma mais rápida de interpretar mal o resultado.
A Tradeways executa os dois modos no navegador com seus trades importados. O escopo ativo da conta e os filtros de Trade atuais definem os dados de entrada. Assim, você pode isolar uma estratégia, um símbolo, uma direção, um intervalo ou outro filtro compatível sem digitar novamente estimativas de taxa de acerto e retorno. A análise de Monte Carlo é atualizada quando esse escopo muda e identifica o resultado como uma simulação baseada em trades passados, não como uma previsão.
O modo de projeção constrói cada caminho um Trade por vez, sorteando resultados do histórico filtrado. Em cada execução, um resultado pode ser sorteado mais de uma vez ou não ser sorteado. Isso é amostragem com reposição.
Você escolhe um horizonte, como os próximos 100 trades, e a simulação repete o processo muitas vezes. O resultado mostra a amplitude dos caminhos e dos resultados finais sob uma hipótese explícita: o histórico selecionado é um modelo útil para os resultados que podem voltar a ocorrer.
A projeção é apropriada quando sua pergunta trata do futuro, mas depende de condições. Ela pode mostrar que uma média histórica positiva ainda permite caminhos com prejuízo, Drawdowns profundos ou longos períodos de recuperação. Ela não mostra se o Edge da estratégia persistirá, se as condições de mercado mudarão ou se os trades futuros seguirão a mesma distribuição.
O modo de reordenação usa cada Trade da amostra filtrada exatamente uma vez em cada caminho e muda apenas sua ordem. Em uma visão de P&L aditivo, todos os caminhos terminam no mesmo total. O que muda é a trajetória até esse total: as sequências de perdas, os picos de capital, o tempo de recuperação e o Drawdown máximo.
Esse modo responde a uma pergunta de atribuição. Se a curva histórica parece estável, mas muitas ordens alternativas contêm Drawdowns muito mais profundos, parte dessa estabilidade veio da sorte na sequência. Se a distribuição do Drawdown permanece estreita entre as diferentes ordens, o caminho observado dependeu menos do momento em que lucros e perdas ocorreram.
A reordenação não cria novos resultados de Trade nem estima o próximo conjunto de trades. Ela também elimina qualquer estrutura serial da sequência original. Se os resultados dependem de regimes, sobreposição de posições ou mudanças deliberadas no tamanho, interprete o resultado como um teste de ordenação, não como um modelo dessas dependências.
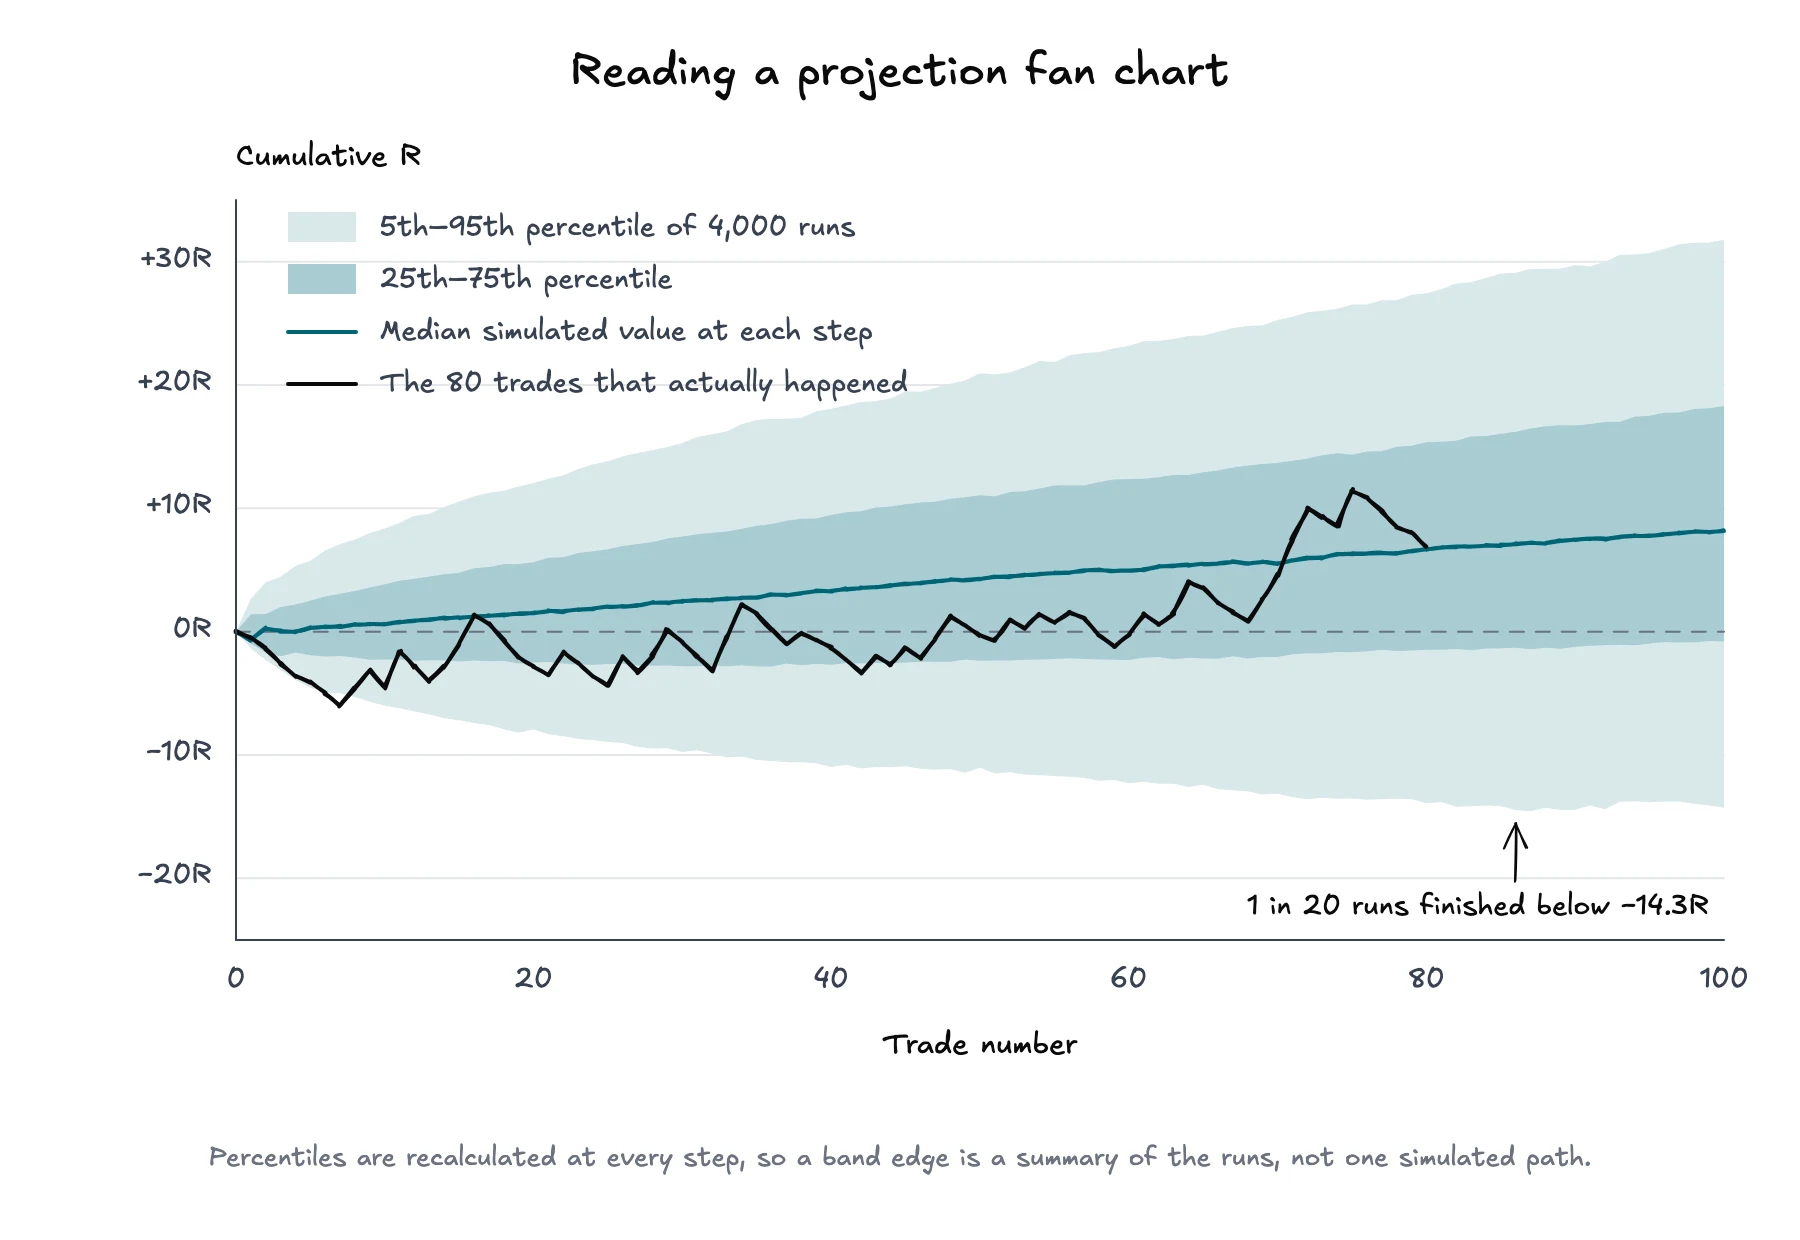
Um gráfico de leque mostra o número de trades no eixo horizontal e o resultado acumulado no eixo vertical. Em cada etapa, a simulação ordena os valores de todos os caminhos e marca os percentis. A linha da mediana mostra o valor simulado central. Faixas mais amplas, como a do 5º ao 95º percentil, mostram uma parcela maior da dispersão simulada.
Uma projeção ilustrativa: 4.000 execuções de 100 trades sorteados de um histórico filtrado de 80. A mediana sobe, mas o 5º percentil não, usando as mesmas evidências.
Leia o gráfico em três etapas:
Leia o centro. A mediana mostra o resultado simulado central em cada número de trades. Ela não é o caminho esperado nem uma promessa.
Leia a largura. Um leque que se alarga rapidamente indica que a sequência produz uma faixa ampla de resultados acumulados sob as hipóteses selecionadas.
Compare a curva real. O caminho histórico mostra onde a sequência realizada fica em relação à faixa simulada. Um caminho próximo de uma faixa externa é incomum dentro deste modelo, mas não prova que a estratégia ou a execução foi incomum em todos os modelos possíveis.
Os limites dos percentis são calculados separadamente em cada etapa. Portanto, a linha do 5º percentil não representa necessariamente um único caminho simulado contínuo nem indica 95% de chance de o capital futuro permanecer acima dela. É um resumo pontual das execuções.
O gráfico de leque mostra resultados acumulados. A distribuição do Drawdown responde a outra pergunta: quanto cada caminho simulado caiu em relação ao próprio pico anterior antes de se recuperar ou terminar?
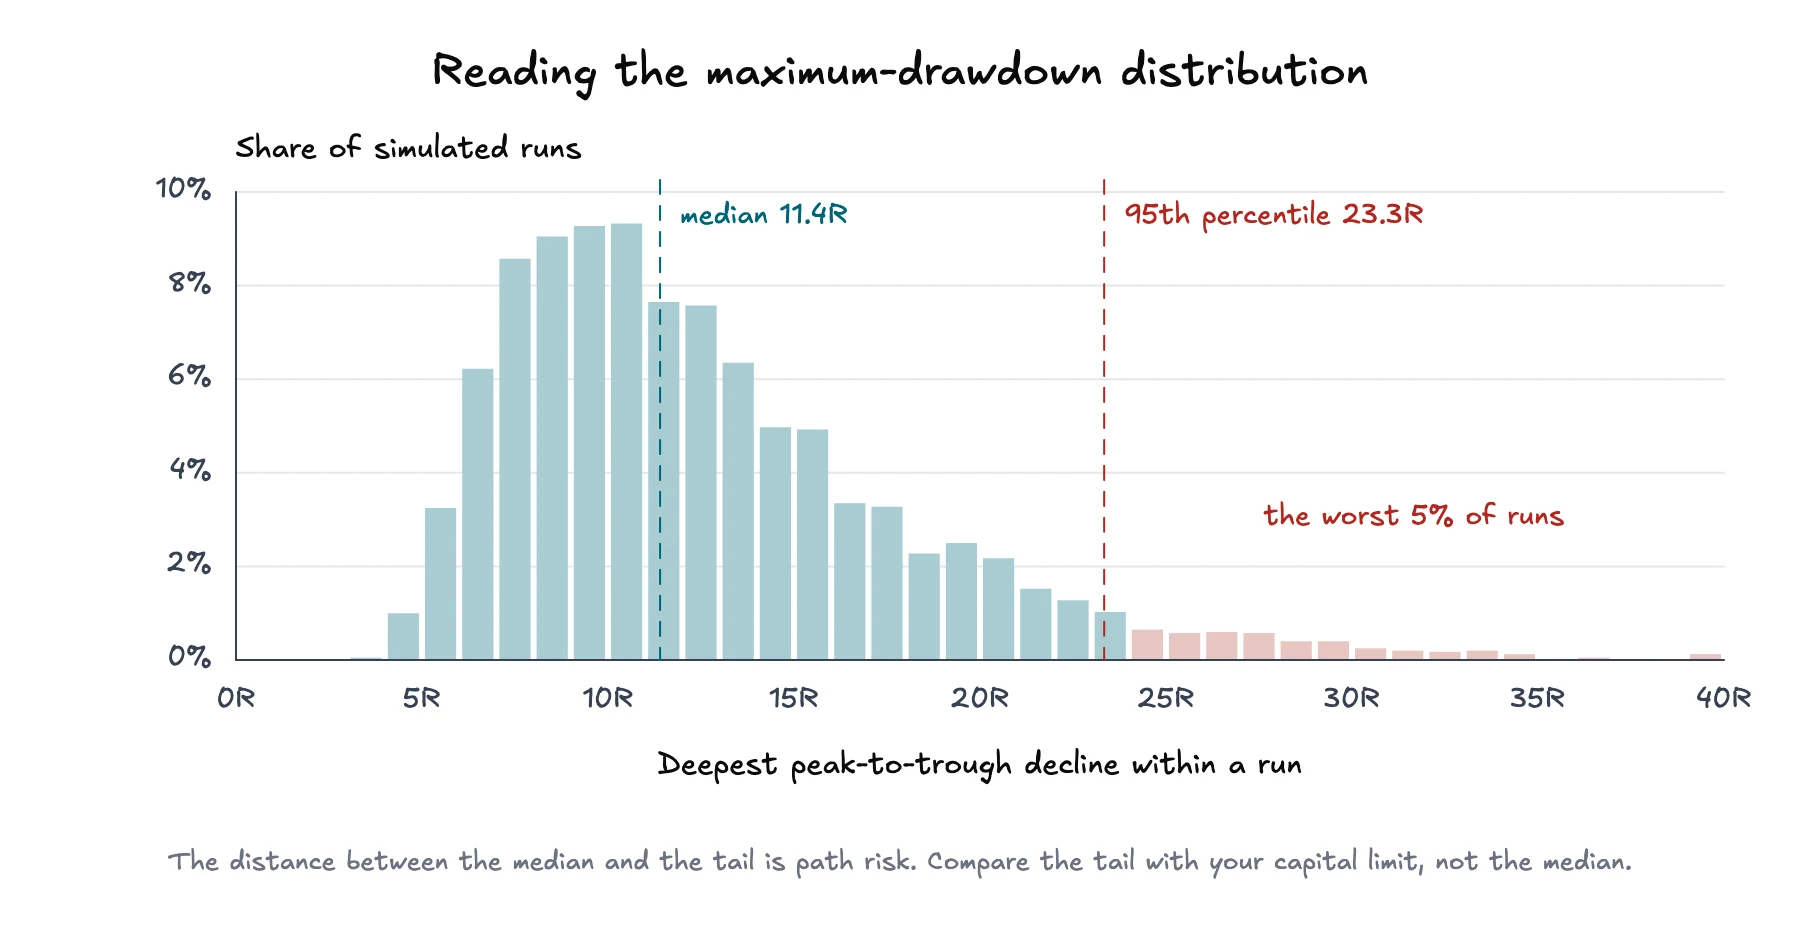
Para cada execução, a simulação registra a maior queda entre pico e fundo daquele caminho. A distribuição agrupa esses Drawdowns máximos. Seu centro descreve uma pior queda simulada típica, enquanto a cauda superior mostra as quedas mais profundas que ocorreram em menos execuções.
As mesmas execuções, outra pergunta. A mediana da pior queda é 11,4R. Uma em cada vinte execuções ultrapassou 23,3R.
Observe principalmente a cauda, não apenas a média. Um Drawdown mediano tolerável pode coexistir com um Drawdown no 95º percentil muito maior. Essa diferença informa sobre o risco da trajetória. Compare-a com suas restrições de capital e com o ponto em que a estratégia deixaria de ser executável conforme o plano.
Isso está relacionado ao risco de ruína, mas não é a mesma coisa. O Drawdown mede a perda entre pico e fundo ao longo de um caminho. A ruína exige um limite de capital definido e pergunta com que frequência um caminho simulado o alcança. O simulador de risco de ruína é útil quando você quer testar hipóteses definidas manualmente para taxa de acerto, retorno, risco por Trade e capital. A análise de Monte Carlo usa a distribuição do seu histórico filtrado de trades importados.
Use a simulação como ferramenta de comparação, não como uma pontuação isolada.
Selecione o escopo da conta e os filtros correspondentes à estratégia ou decisão que você está avaliando.
Confira a amostra antes de interpretar o resultado. Confirme se exclusões, valores ausentes e quantidade de trades correspondentes são aceitáveis.
Execute primeiro o modo de reordenação para separar o desempenho total da sorte na ordem dos resultados.
Leia a cauda do Drawdown máximo e a faixa de sequências de perdas antes da mediana do resultado final.
Mude para o modo de projeção, escolha um horizonte adequado ao período da decisão e observe a velocidade com que o leque se alarga.
Altere um filtro justificável por vez. Se a remoção de um regime de mercado, Setup ou conta mudar muito a distribuição, investigue o motivo em vez de selecionar o resultado que você prefere.
A simulação mostra a sensibilidade dos resultados observados à amostragem e à ordem. Ela não pode validar o Edge da estratégia, corrigir dados de entrada enviesados nem escolher o tamanho de uma posição. O tamanho da posição é uma decisão separada. O critério de Kelly descreve uma fração que maximiza o crescimento sob hipóteses fortes, enquanto a análise do risco de ruína se concentra na chance de ultrapassar um limite de capital.
Um resultado de Monte Carlo fundamenta afirmações condicionais aos dados de entrada: com esta amostra filtrada, este modo, este horizonte e este número de execuções, apareceu determinada faixa. Ele não fundamenta afirmações de que um retorno ou Drawdown futuro é garantido, de que os resultados são independentes ou de que a amostra filtrada continuará representativa.
Essa limitação não é motivo para descartar a análise. É por isso que você deve identificar a procedência, examinar as caudas e executar o teste novamente quando o conjunto de trades mudar. O valor não está em uma curva de capital mais atraente. Está em uma visão mais clara da incerteza que as mesmas evidências de Trade já contêm.