Blog
Build a trading dashboard you can verify
Set up a post-trade dashboard, choose widgets for one review task, and check account and filter scope before comparing results.
8 min readDennis Jahn#Journaling
Build your trading dashboard around the trades you want to review. Choose an account, a date range, and whether you want to include open or closed trades. Apply those settings to the widgets you plan to compare, then check their trade count against the Trade Log.
This guide walks you through a dashboard for reviewing closed trades. You will choose the widgets, check which trades each one includes, and investigate a count that changes because of a filter setting.
Choose a question before choosing widgets
Start with a question you need the dashboard to answer. For example: "What happened in my closed trades this week, and which trades still need review?"
For that question, you need the week's results and a way to find unfinished reviews. Start with these widgets:
| Widget | Question it answers | What to verify |
|---|---|---|
| Trade count | How many trades are included? | Does it count the account and closed trades you selected? |
| P&L | What is the calculated result for this set? | Does it use the same display unit and currency as the figures you compare it with? |
| P&L per trading day | What happened on each trading day? | Does it include the same trades, grouped in your selected timezone? |
| Recent trades | Which records can I inspect? | Does its row limit hide some of the matching trades? |
| Outstanding reviews | What review work remains? | Is it showing unfinished reviews for the strategy you intend to review? |
Add another widget when you have another question. If you want to understand a win-rate figure, for example, compare it with average win and average loss. Check whether your winning trades and losing trades differ in size. You do not need a second card that repeats a result you can already see.
Keep the unfinished reviews in their own widget. If you filter the entire dashboard to unreviewed trades, each trade you mark reviewed leaves the totals too. Your weekly figures would then describe only the work you have left, rather than all the trades you took that week.
Build the layout in Tradeways
Open Cockpit and select a dashboard. To edit a system dashboard, select Edit and create a personal copy when prompted. You can also create a personal dashboard from Manage in the Dashboards section.
In edit mode, use Add Widget to find the measures and lists you need. Move widgets by their headers and resize them from their edges. Put the trade count beside the P&L card so you can see how many trades contributed to the result.
Arrange Desktop, Tablet, and Mobile separately, then select Save. The saved layout is shared across accounts, so switching accounts does not rearrange it. You can also set an individual widget to use a specific account. Available widgets depend on your plan, data, and permissions.
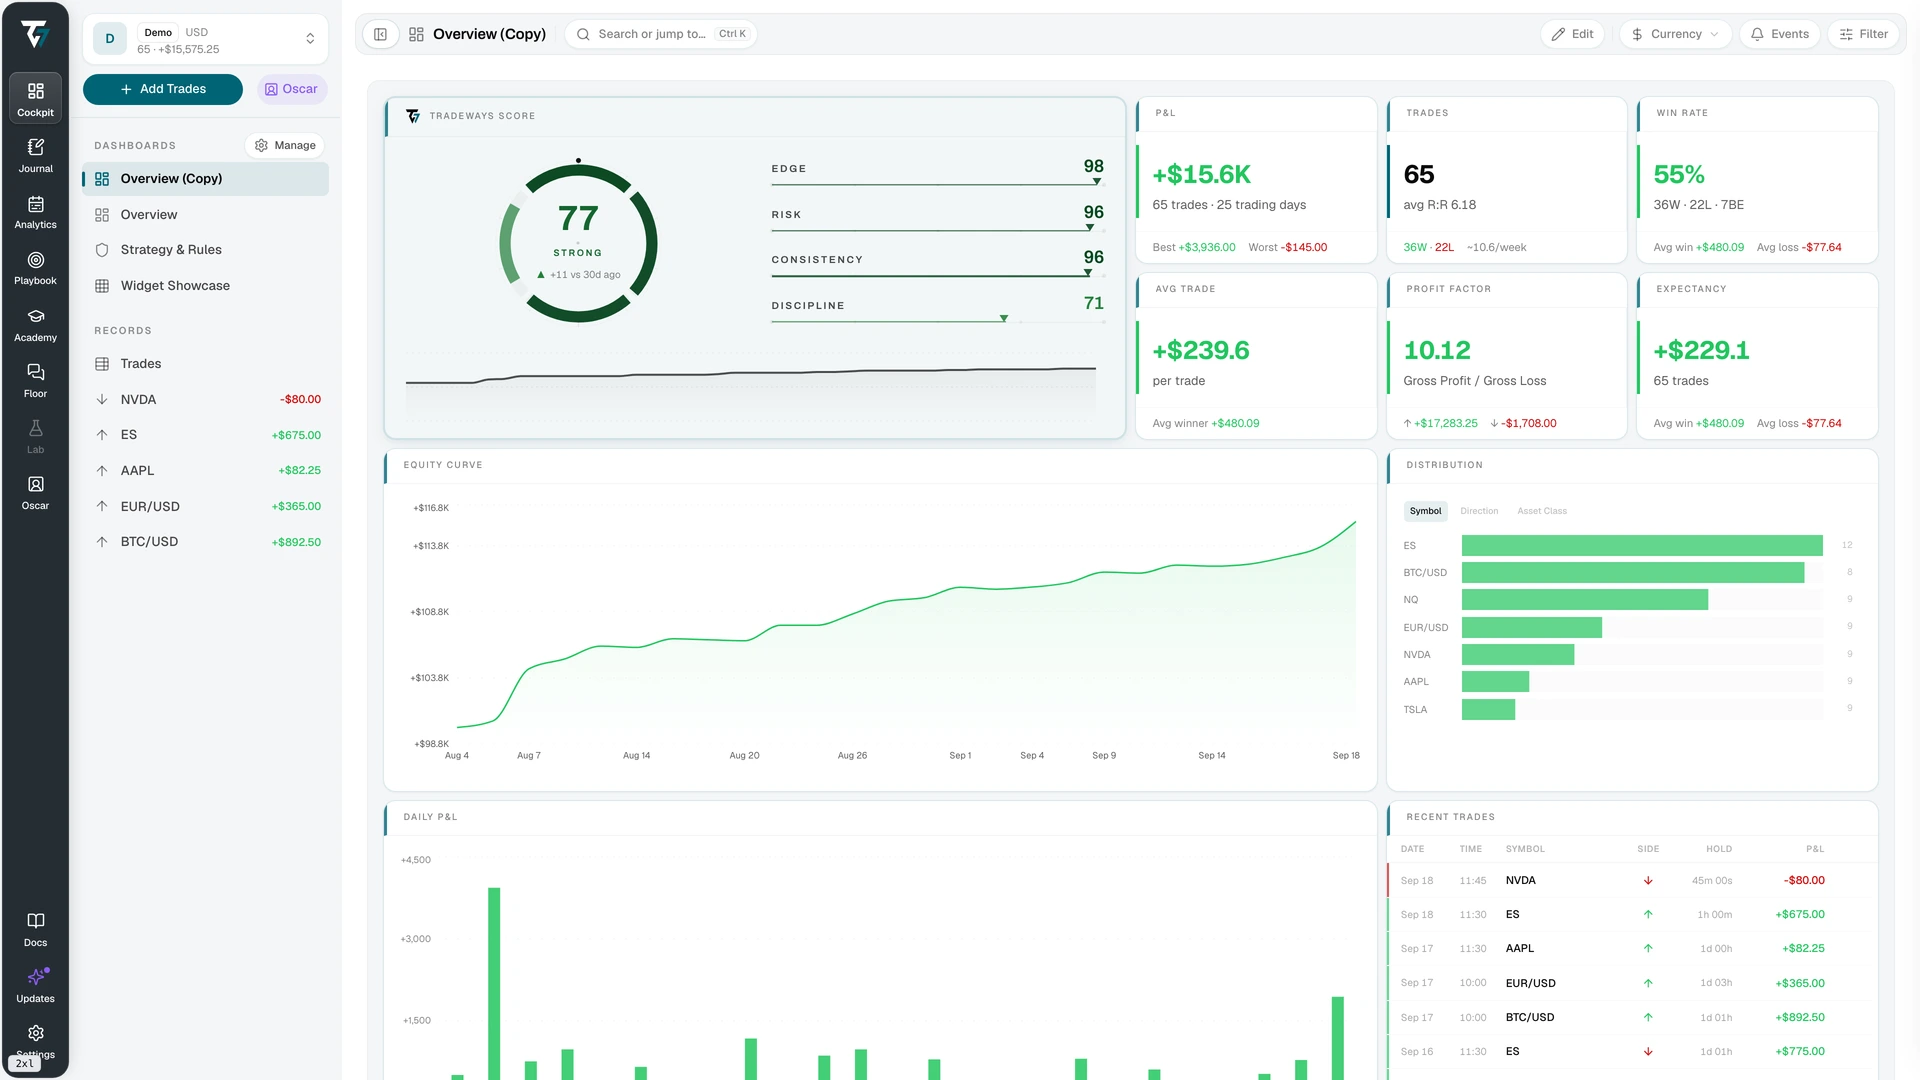
Open the dashboard screenshot at full size.
Are the widgets looking at the same trades?
If a card looks wrong, check which trades it includes before changing the trade records. It might be using a different account or a wider date range than the rest of the dashboard.
Start with the account selector at the top of the dashboard. In a widget's Settings tab, Use active account makes the widget follow that selector. Choosing a specific account pins the widget to it, even when you switch the dashboard to another account.
Use an account pin when you want to compare accounts, and name the account in the widget title. For a review of one account, check that every card you are comparing follows that account.
Next, open Filter in the toolbar. This is the global filter that most widgets follow. Set your review period and select closed trades. Check the timezone used for the dates and the unit used for P&L. Choose the same unit for the results you compare, and check the currency when displaying money.
Finally, inspect each widget's Filter tab. Tradeways provides two modes:
| Mode | What the widget uses | When it fits |
|---|---|---|
| Layer | Only trades that match both the global filter and the widget filter. | You want to review one strategy within the week selected on the dashboard. |
| Replace | The widget filter instead of the global filter. | You want a reference card that keeps its own date range when you change the dashboard filter. |
The account setting and the filter are separate. If you change a widget's filter, it still reads from the account you selected for that widget.
Why one setting can change a count from four to six
Suppose your account has six closed trades assigned to Strategy A. Four fall between 14 and 18 September 2026, and two are from the previous week. These counts are illustrative and do not come from the screenshot above.
Set the global filter to closed trades from 14 through 18 September. Then give a Trade count widget a filter for Strategy A, with no date or status restriction of its own. Keep the widget on the same account.
| Widget filter mode | Trades included | Displayed count |
|---|---|---|
| Layer | Strategy A trades that also match the global date and status filters. | 4 |
| Replace | All Strategy A trades in this example, including the two from the previous week. | 6 |
Replace shows two more trades because it removes the global date restriction from this widget. The trade records have not changed. For your selected week's review, use Layer so the card counts the four trades from that week.
Replace is useful when you deliberately want a card with its own review period. Set that period in the widget filter and put it in the title so you can tell why the card differs from the rest of the dashboard.
Each widget still has its own calculation requirements. A performance widget that uses only closed trades will not start counting open trades just because you select Replace.
A layered filter can also leave you with no matching trades. If the global filter selects only Strategy B while the widget selects only Strategy A, no trade can match both. Check for that conflict before assuming your import is missing records.
Some widgets answer a different question
The Pre-Trade Check uses the current session and strategy rules. It does not apply global or widget trade filters. If you add it to this dashboard, read it as a check of the current session, even while the other cards show a past week.
A journal widget shows the note or journal source you selected. Check that you are reading the note for the period you intend to review. Strategy widgets can follow your active strategy or stay pinned to a specific one. Check that selection before comparing a strategy result with a summary of the whole account.
Check the dashboard against the Trade Log
Before you rely on the dashboard for your next review, check that you can find the trades behind its figures:
- Select one account and a short completed period. Confirm the timezone and use closed trades.
- Check the account and filter on each widget you want to compare. Remove settings you did not intend to use, and title any card that deliberately shows a different account or period.
- Open the Trade Log with the same global filter. Clear its local filters, which can hide trades that still appear in your dashboard totals. If you are checking a widget filtered to one strategy, apply that same strategy filter to the Trade Log.
- Compare the dashboard trade count with the matching records. Do not use only the visible Recent trades rows as the total; that widget has a row limit.
- Open a trade and inspect its executions, fees, timestamps, and calculated result. If a card disagrees, check whether it uses the same trades and display unit before editing the record.
- Write down what you checked and what explained any difference. Link the trades you inspected so you can return to them.
For the four-versus-six example, your note could read like this. This is an illustrative journal entry:
I checked closed trades for Strategy A from 14 to 18 September 2026 in my Practice account, using Europe/Zurich time.
The dashboard card showed six trades because its filter used Replace. Two trades were from the previous week. I changed it to Layer, and both the card and the Trade Log showed four matching trades. I did not change any trade records.
Repeat the check after correcting an import or changing the filters used for the review. Saving a layout keeps the arrangement; its figures still update when the underlying records change.
Recover from empty or incomplete results
A missing value is not a zero. Use the widget's state to decide what to inspect.
| State | Next check |
|---|---|
| Loading | Wait for the widget to finish loading before interpreting its value. |
| Empty | Check the account, dates, and trade status. If you use Layer, check that trades can match both filters. |
| Unavailable | Check whether the pinned account or shared source is still accessible. |
| Partial or blank calculation | Read what the metric needs. It may lack a starting balance, an exchange rate, or enough matching trades. |
| Error | Use the widget's Retry action, then inspect the source if the failure persists. |
When you use All Accounts, look for the notice about items excluded because an exchange rate is missing. A combined figure with excluded items is incomplete. Investigate the missing rate before using that figure in your review.
When the numbers are valid but difficult to compare, simplify the layout. Keep the count and result together, move record lists near the relevant summary, and remove widgets you did not use in the review. Check the mobile arrangement after the desktop layout works.
Save the layout you will use for your next review
Name the dashboard after the review, such as "Closed-trade weekly review." Before you finish, check that you can explain any card with a different account or period and open the trades behind the figures you will use.
The dashboard describes recorded activity. It does not establish that a pattern will persist or predict the next trade. Read the Tradeways risk disclosure before using historical results to support a trading decision.
Explore Tradeways dashboards before building your own review layout.
Trading involves risk. Tradeways provides journaling and analytics software, not investment advice. Read the risk disclosure.
Related
How to start a trading journal with 20 trades
Start with one account and a short trade note. Follow a completed example, review your first 20 closed trades, and choose what to record next.
6 min read
How to choose a day trading journal
Test a day trading journal with one week of trades. Check imports, review unfinished notes, and use a completed example to write a weekly decision.
6 min read
How to build a Notion trading journal
Build a Notion trading journal with linked trades and weekly reviews. Follow a worked example, set up a trade-count rollup, and check your records.
6 min read